What is Candlepower Distribution Curve
Candlepower distribution curve is a graphical representation that illustrates how the intensity of light is distributed from a lamp or light fixture. This curve provides valuable information about the directionality and spread of light emitted by the fixture.
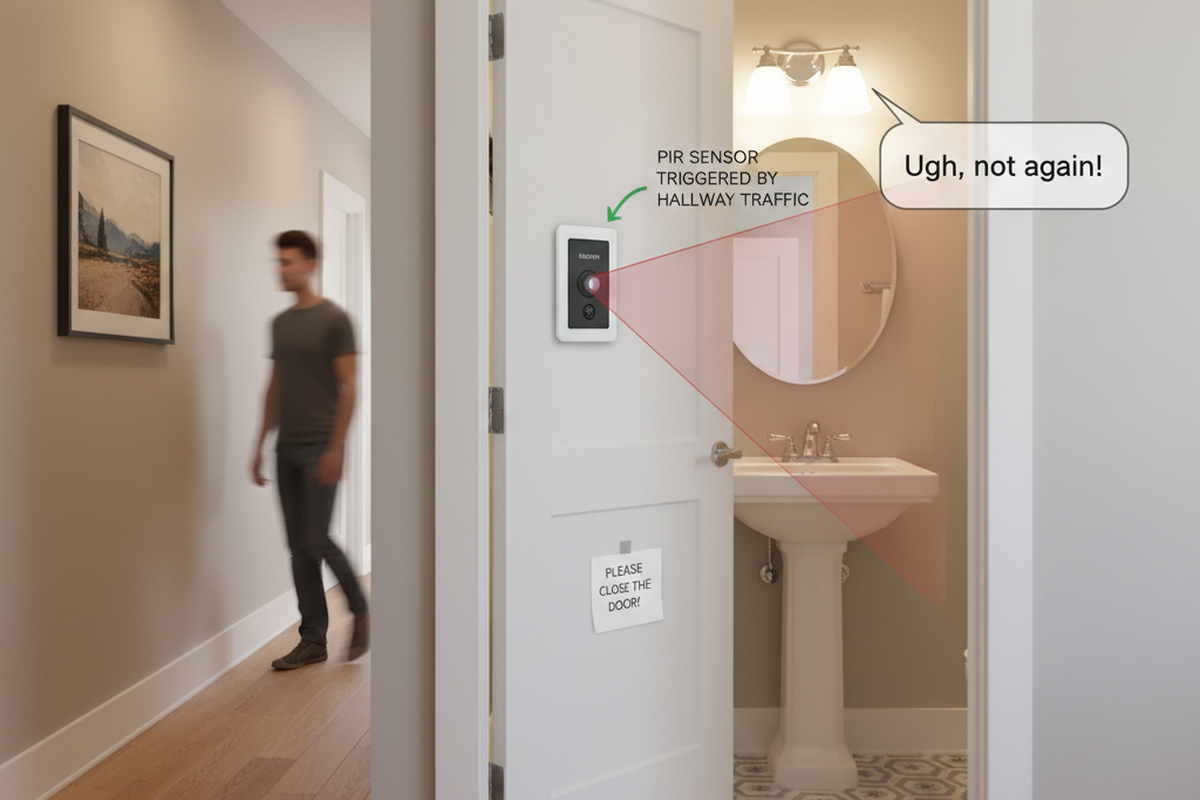
The curve is created by measuring the candlepower, which represents the intensity of light, at various angles in a specific plane. It visually depicts the light distribution pattern by showing the intensity of light emitted in each direction. The curve typically includes a horizontal line at 90°-270°, which divides the graph into two parts: the portion above represents indirect light shining above the fixture, while the portion below represents direct light shining down.
Get Inspired by Rayzeek Motion Sensor Portfolios.
Doesn't find what you want? Don't worry. There are always alternate ways to solve your problems. Maybe one of our portfolios can help.
By analyzing the candlepower distribution curve, designers and users can gain insights into how the light is distributed and where it is directed. This information is crucial for making informed decisions about lighting placement and coverage. The curve helps determine the uniformity of illumination, calculate parameters like mean horizontal candle power (MHCP) and mean spherical candle power (MSCP), and assess the actual illumination of a surface.
Maybe You Are Interested In
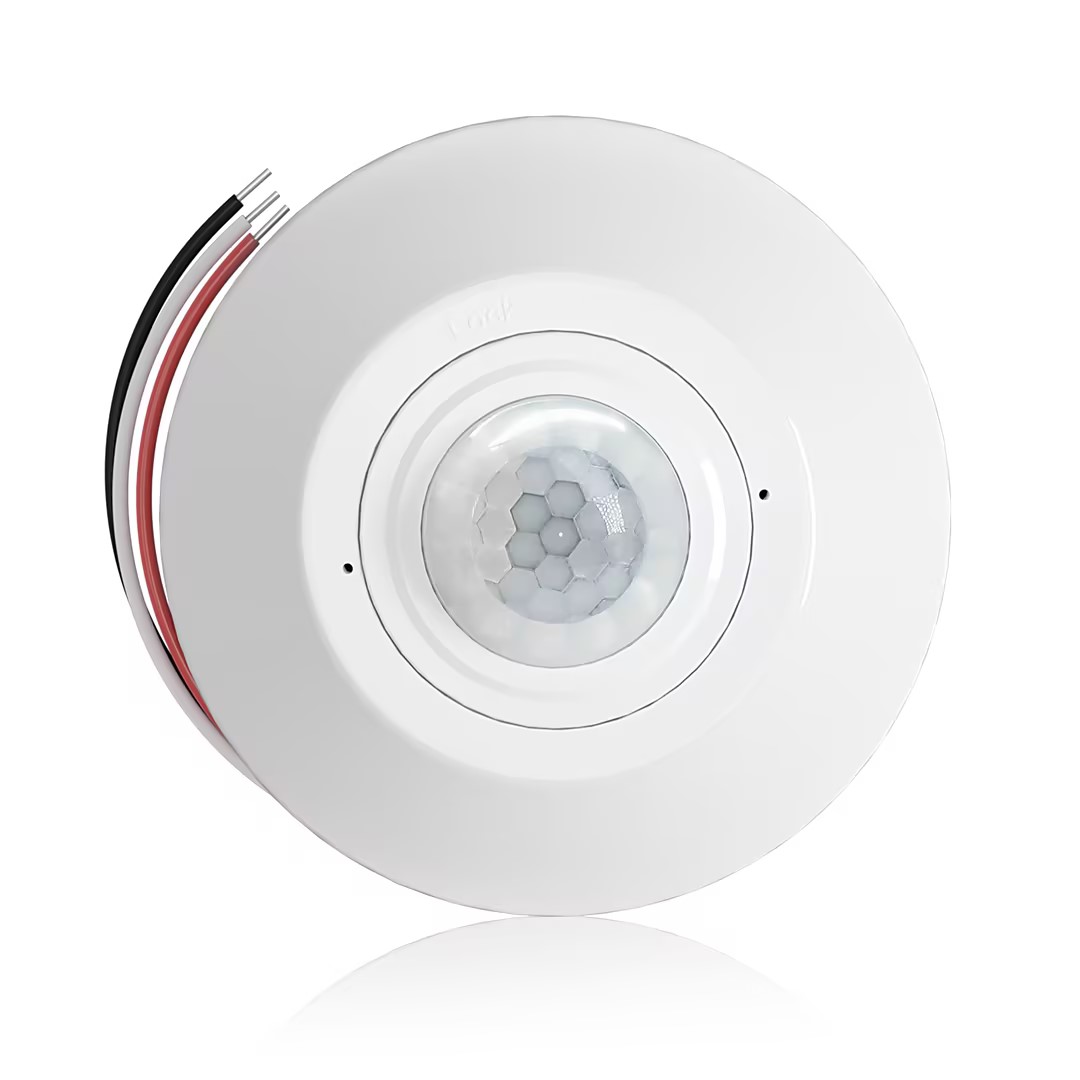
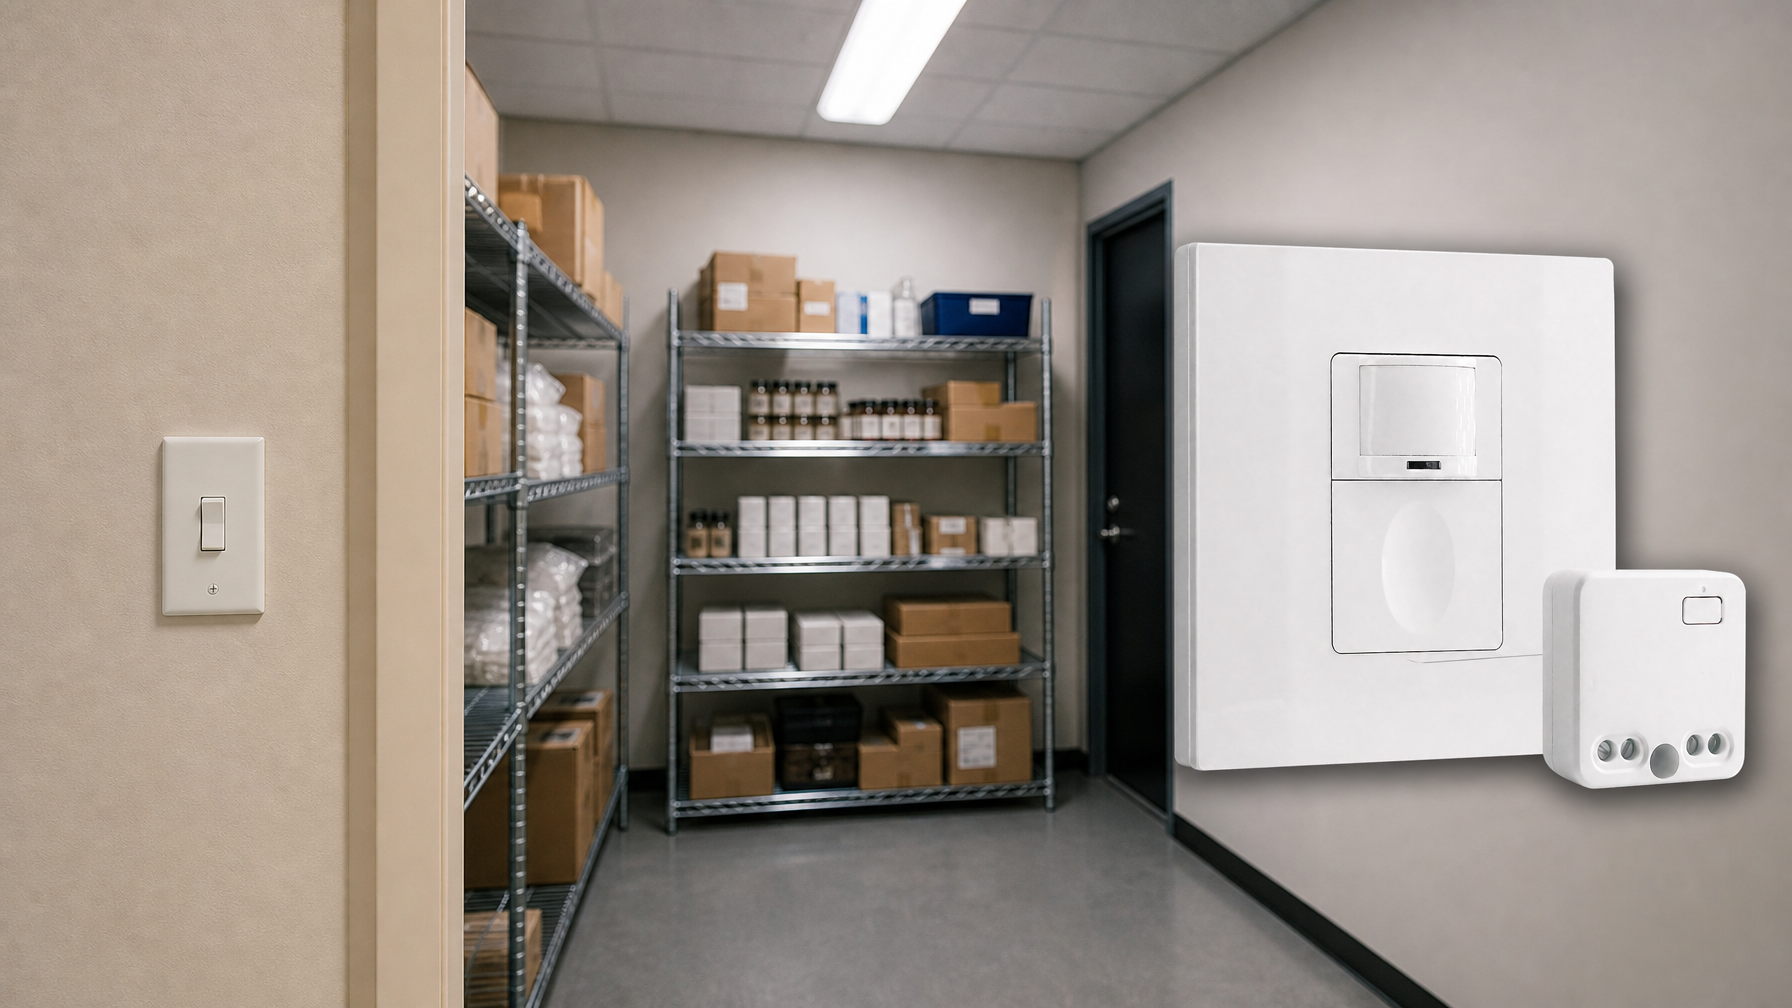
- Ceiling-mounted PIR occupancy sensor with dry-contact relay output
- 12/24VDC or 12/24VAC low-voltage supply
- COM, NO, and NC isolated relay contacts for EMS, HVAC, and building control inputs
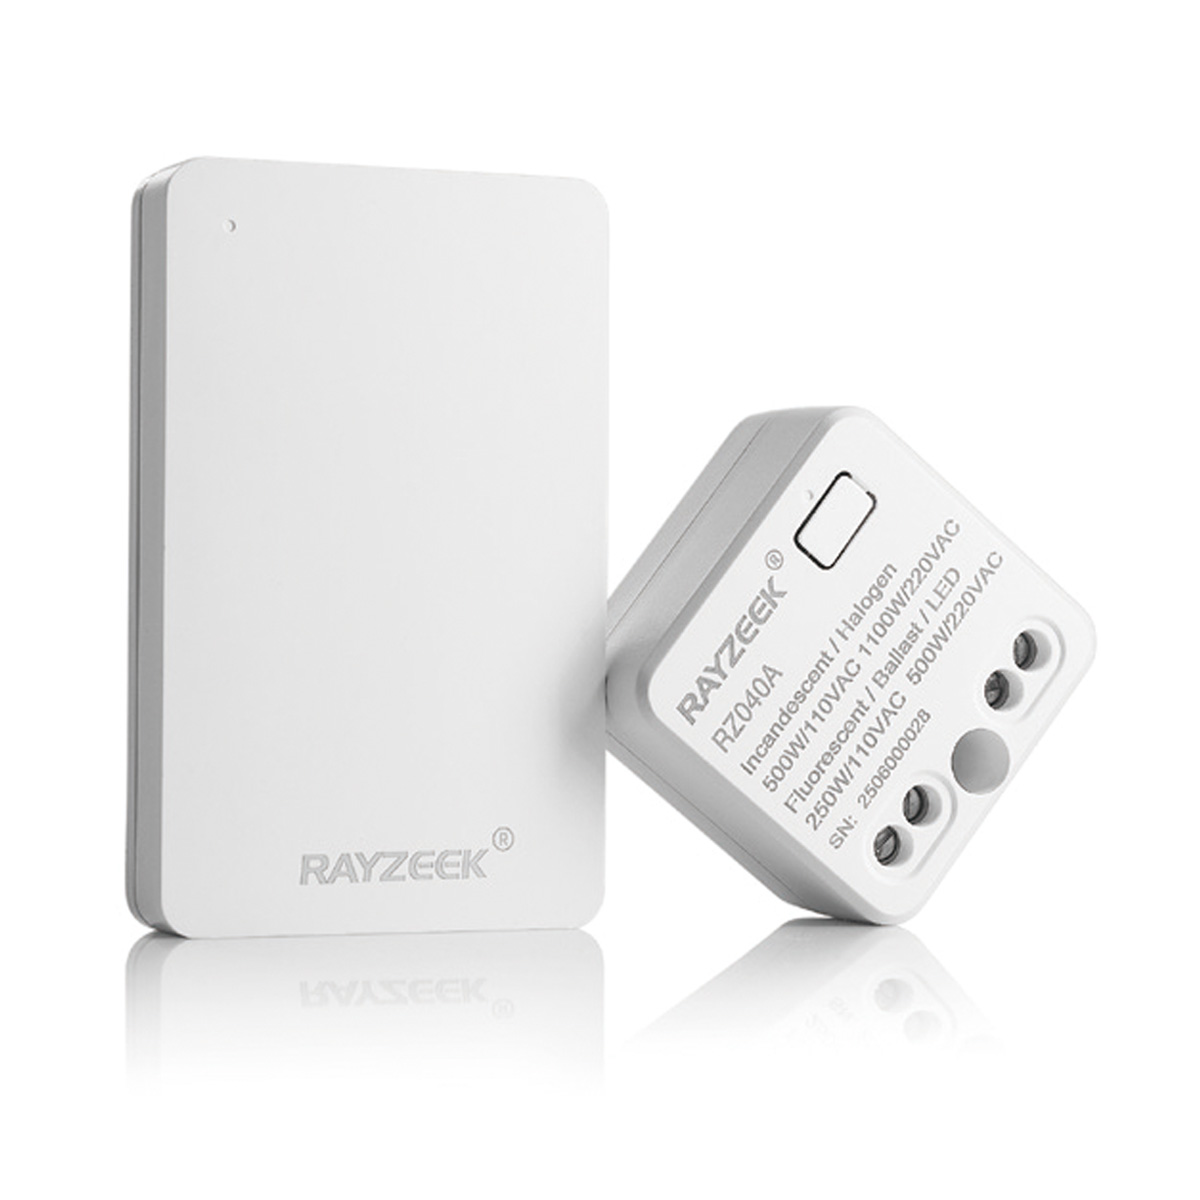
- Low-voltage DC recessed ceiling-mounted microwave motion sensor switch
- 12 VDC / 24 VDC input with 10-30 VDC range
- 10A max work current with adjustable time delay, Lux threshold, and sensitivity
- Higher-load recessed ceiling-mounted microwave motion sensor switch
- 100-265 VAC line-voltage input, 10A model
- 5.8 GHz microwave sensing with adjustable time delay, Lux threshold, and sensitivity
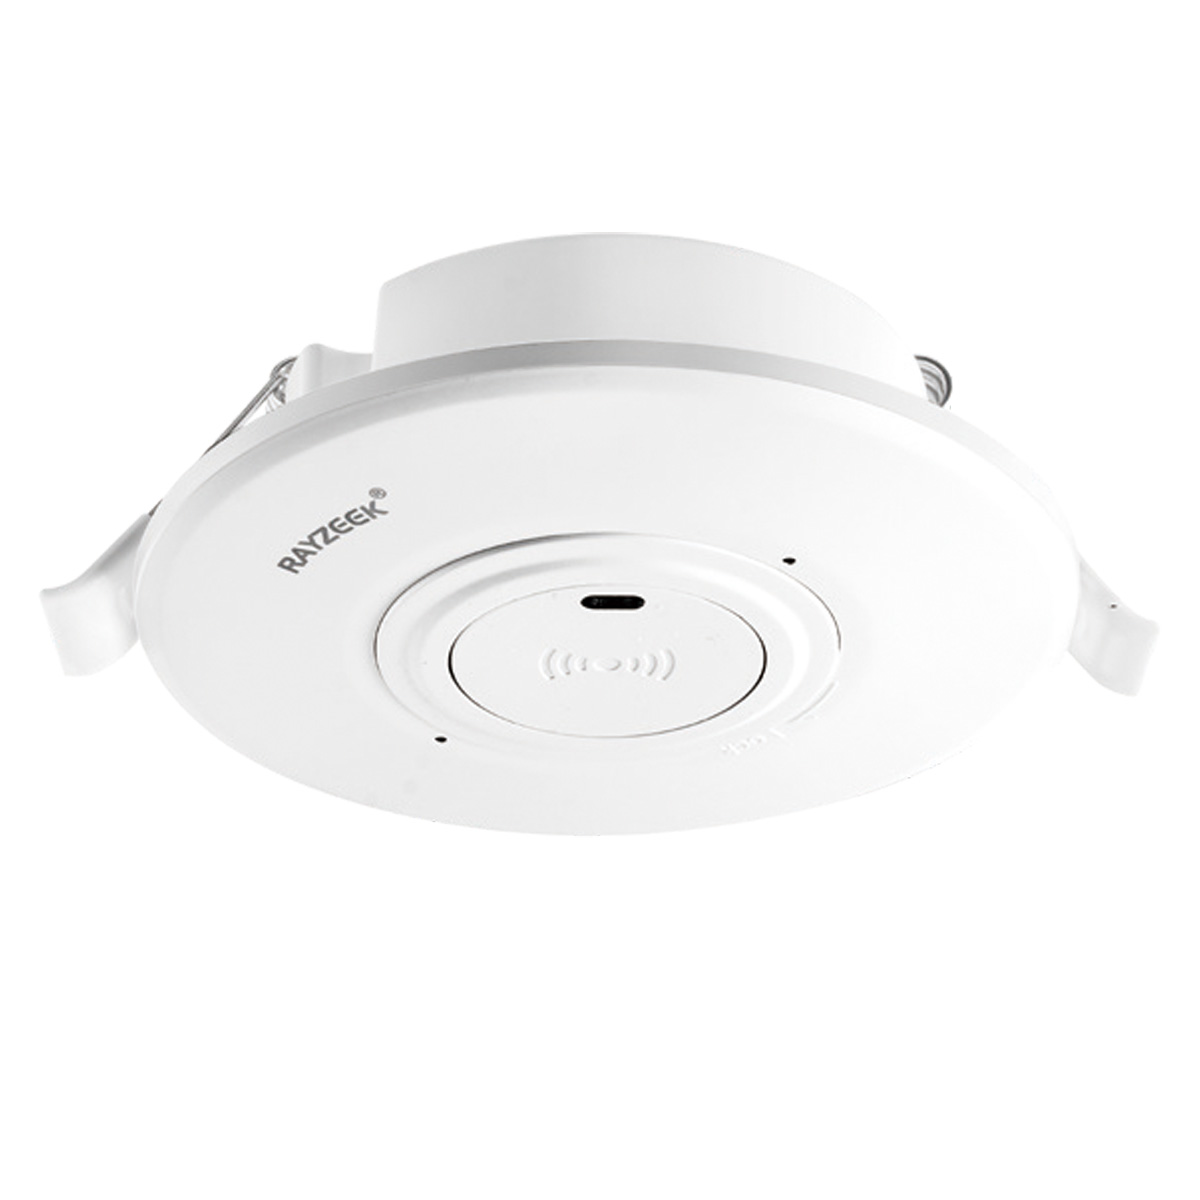
- Recessed ceiling-mounted microwave motion sensor switch
- 100-265 VAC line-voltage input, 5A model
- 5.8 GHz microwave sensing with adjustable time delay, Lux threshold, and sensitivity
- Ceiling-mounted RZ037 PIR occupancy sensor dimmer for 220V power
- 3A maximum working current with 660W rated load
- LUX button controls light-sensor ON/OFF and user-set dimming brightness
- Ceiling-mounted RZ037 PIR occupancy sensor dimmer for 110V power
- 3A maximum working current with 330W rated load
- LUX button controls light-sensor ON/OFF and user-set dimming brightness
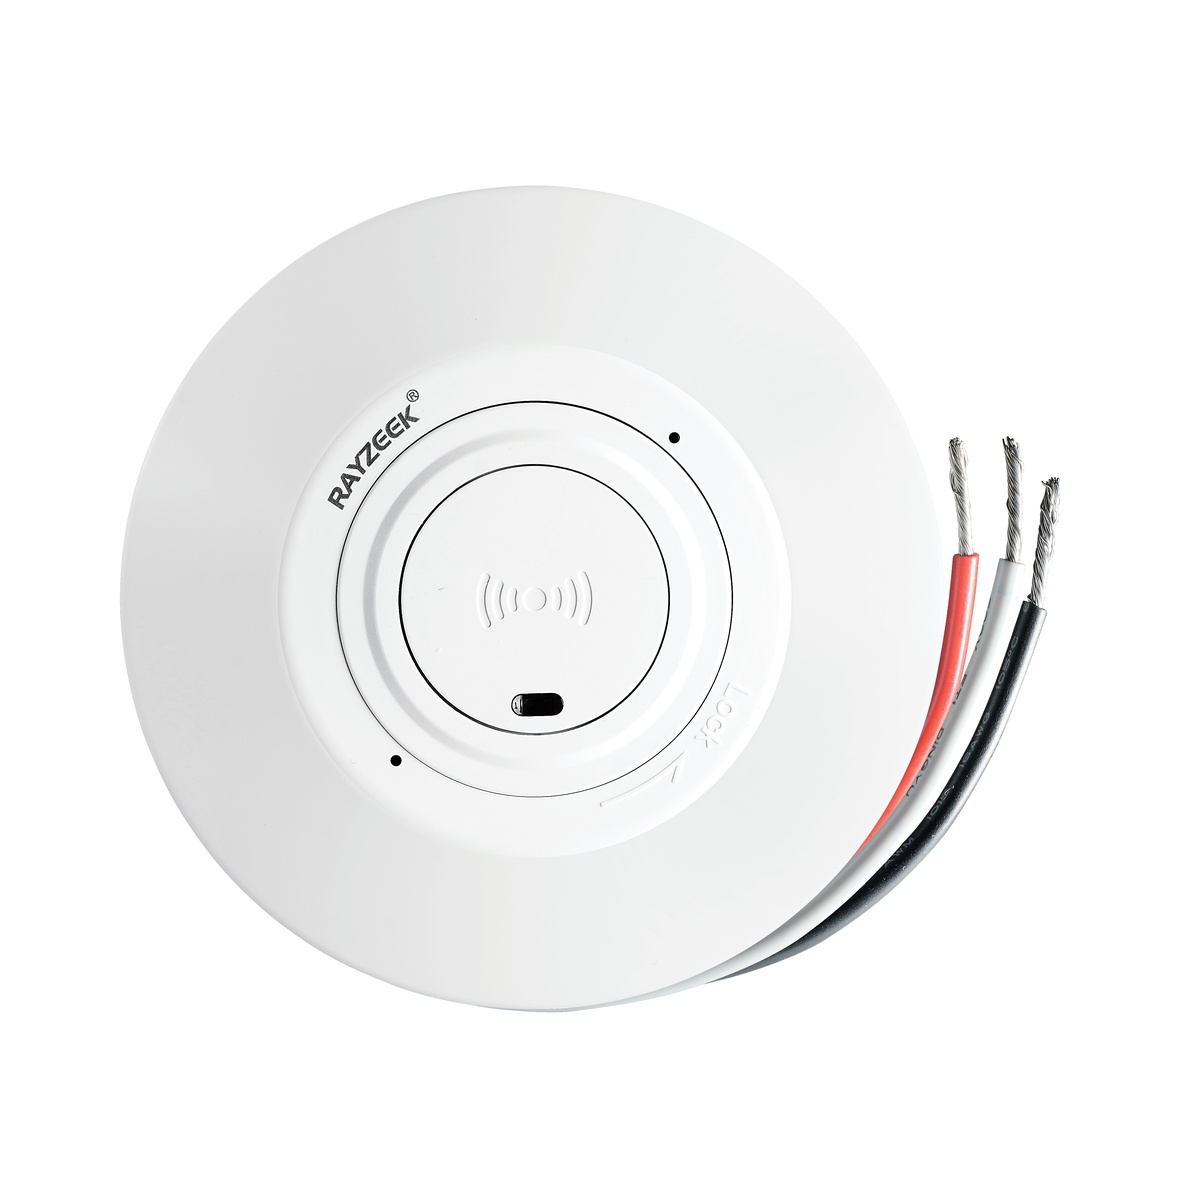
- Low-voltage DC ceiling-mounted microwave motion sensor switch
- 12 VDC / 24 VDC input with 10-30 VDC range
- 10A max work current with adjustable time delay, Lux threshold, and sensitivity
- Higher-load ceiling-mounted microwave motion sensor switch
- 100-265 VAC line-voltage input, 10A model
- 5.8 GHz microwave sensing with adjustable time delay, Lux threshold, and sensitivity
- Ceiling-mounted microwave motion sensor switch
- 100-265 VAC line-voltage input, 5A model
- 5.8 GHz microwave sensing with adjustable time delay, Lux threshold, and sensitivity
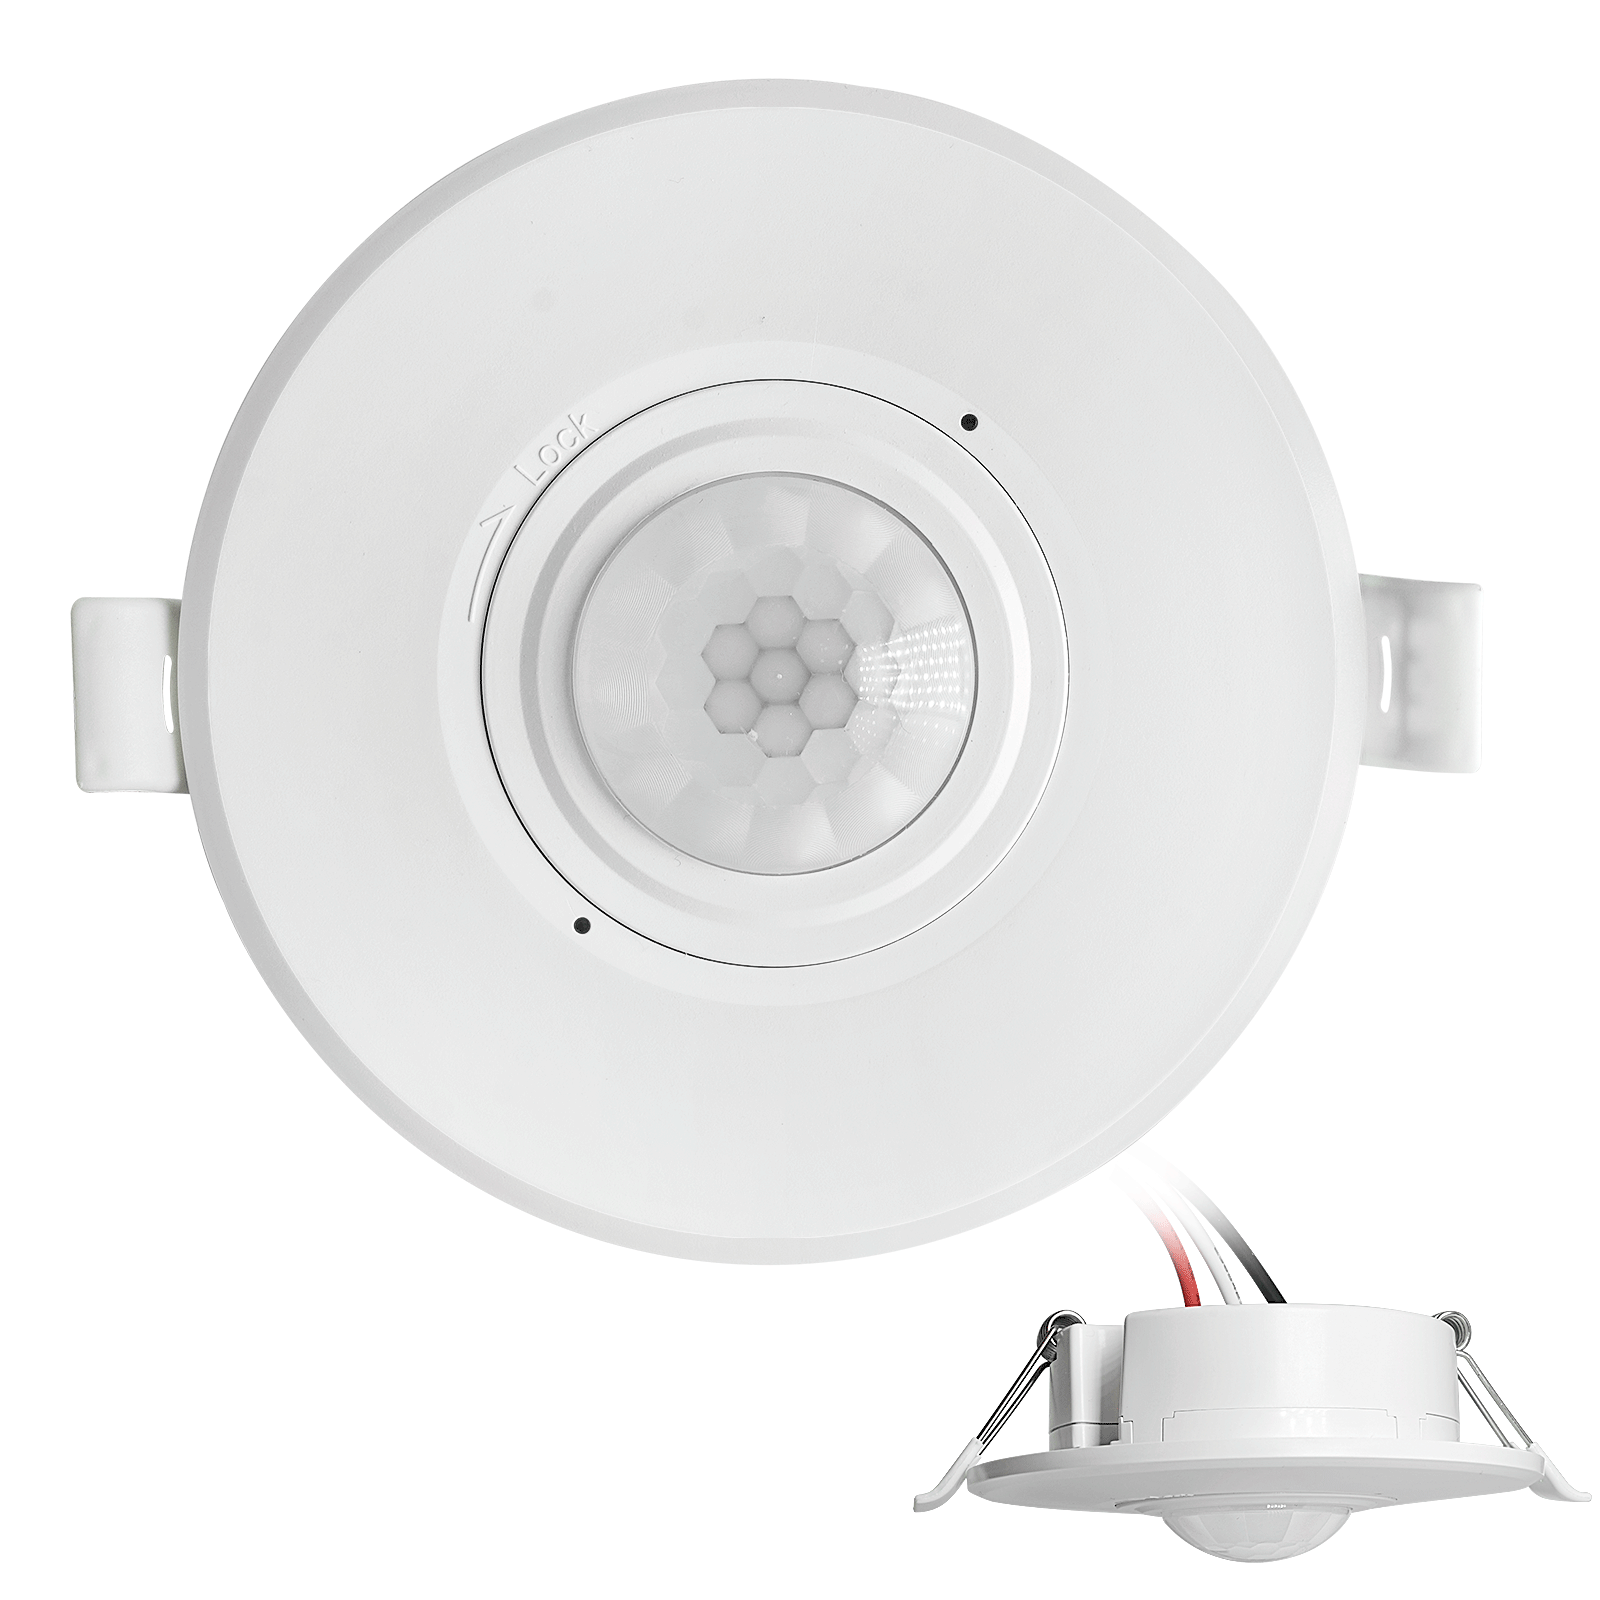
- Low-voltage DC recessed ceiling mount PIR motion sensor switch
- 12 VDC / 24 VDC input with 10-30 VDC range
- Max work current 10A with adjustable time delay, Lux threshold, and sensitivity
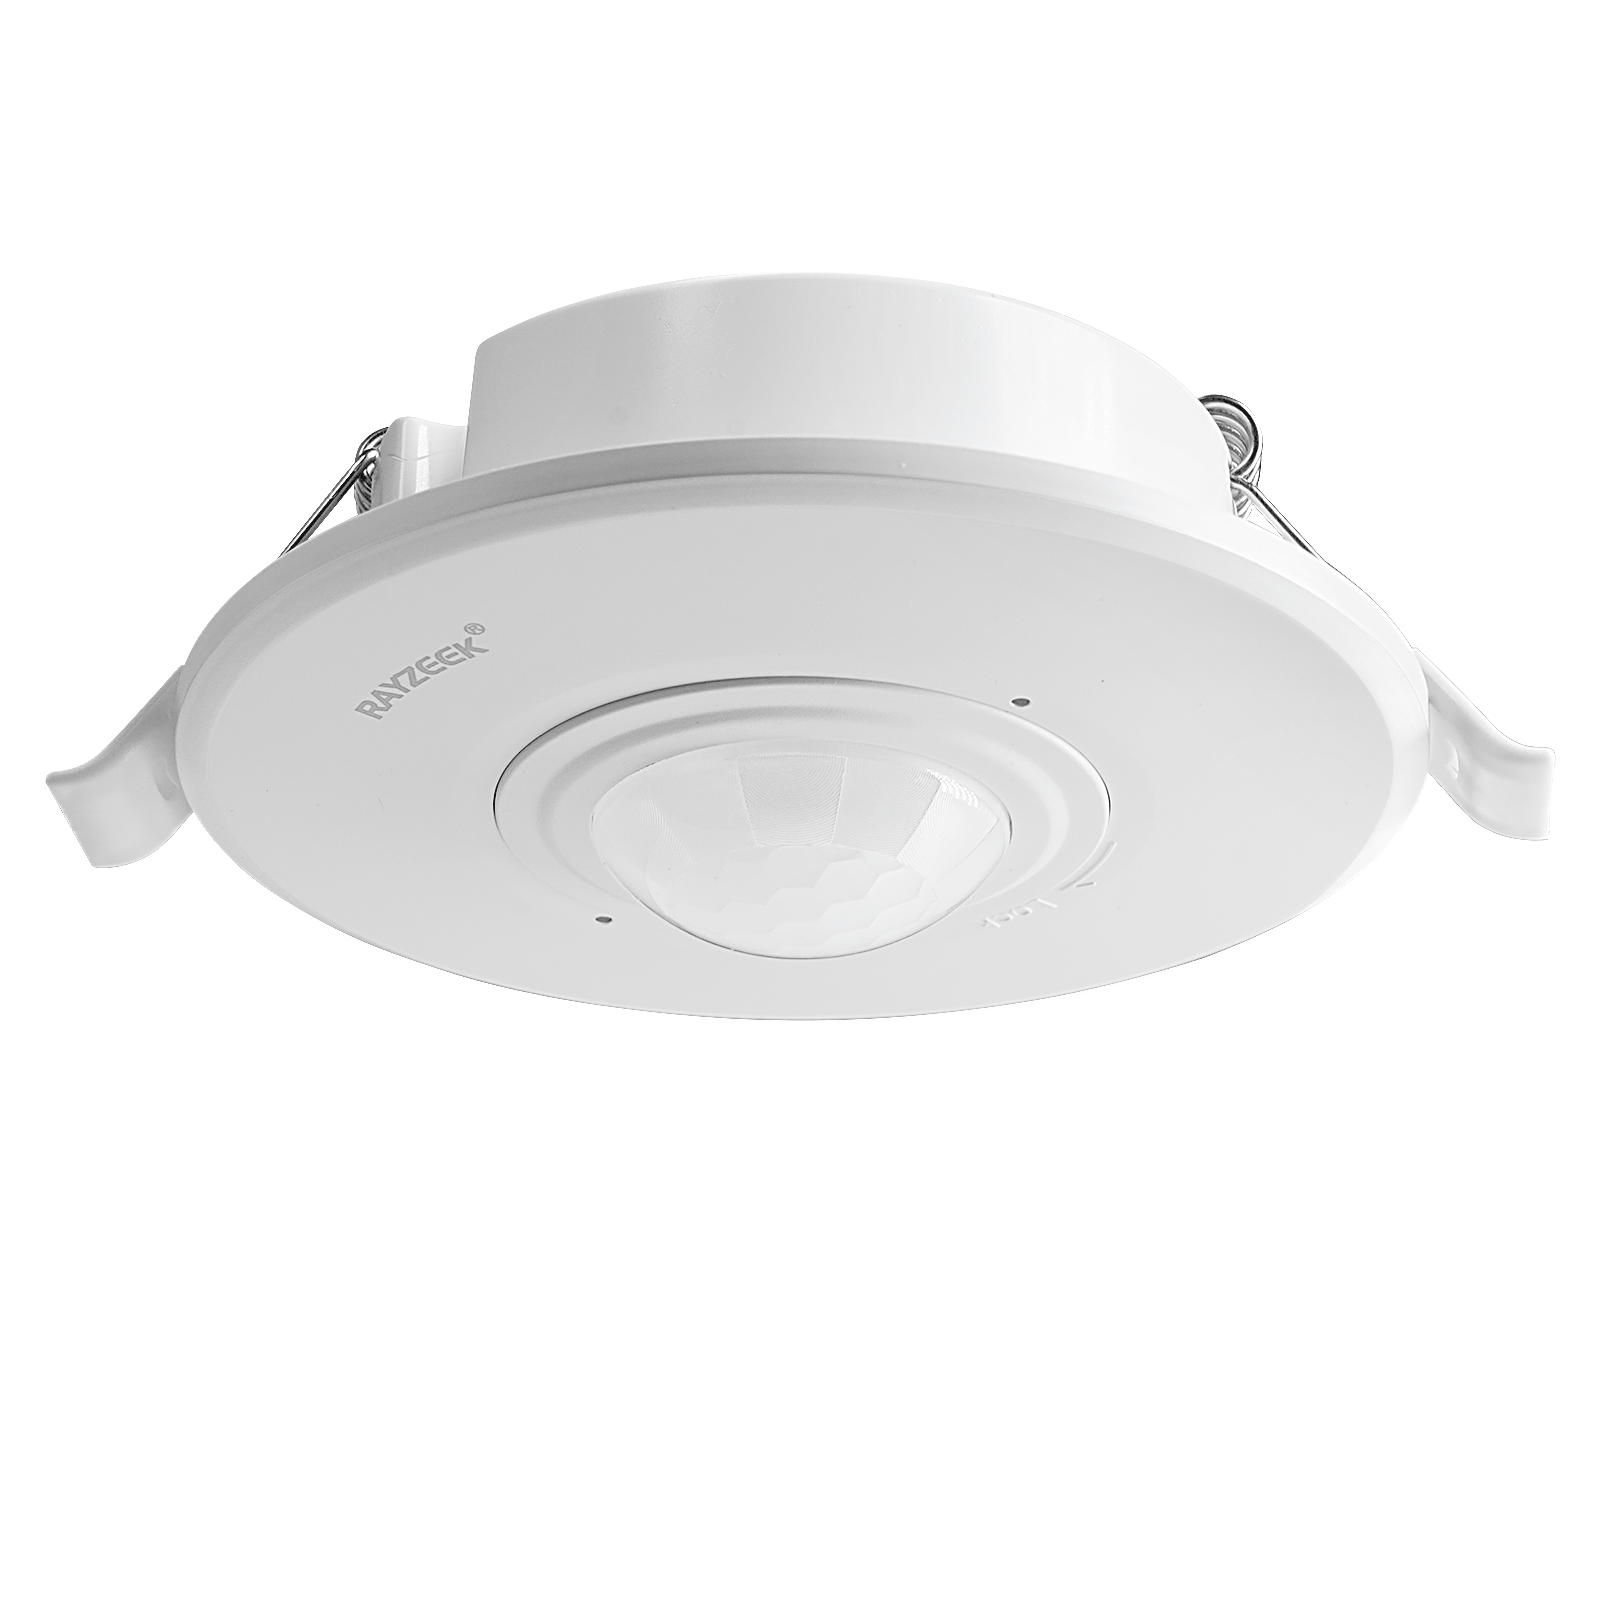
- Higher-load recessed ceiling mount PIR motion sensor switch
- 100-265 VAC line-voltage input, 10A model
- 360-degree detection with adjustable time delay, Lux threshold, and sensitivity
- Recessed ceiling mount PIR motion sensor switch
- 100-265 VAC line-voltage input, 5A model
- 360-degree detection with adjustable time delay, Lux threshold, and sensitivity
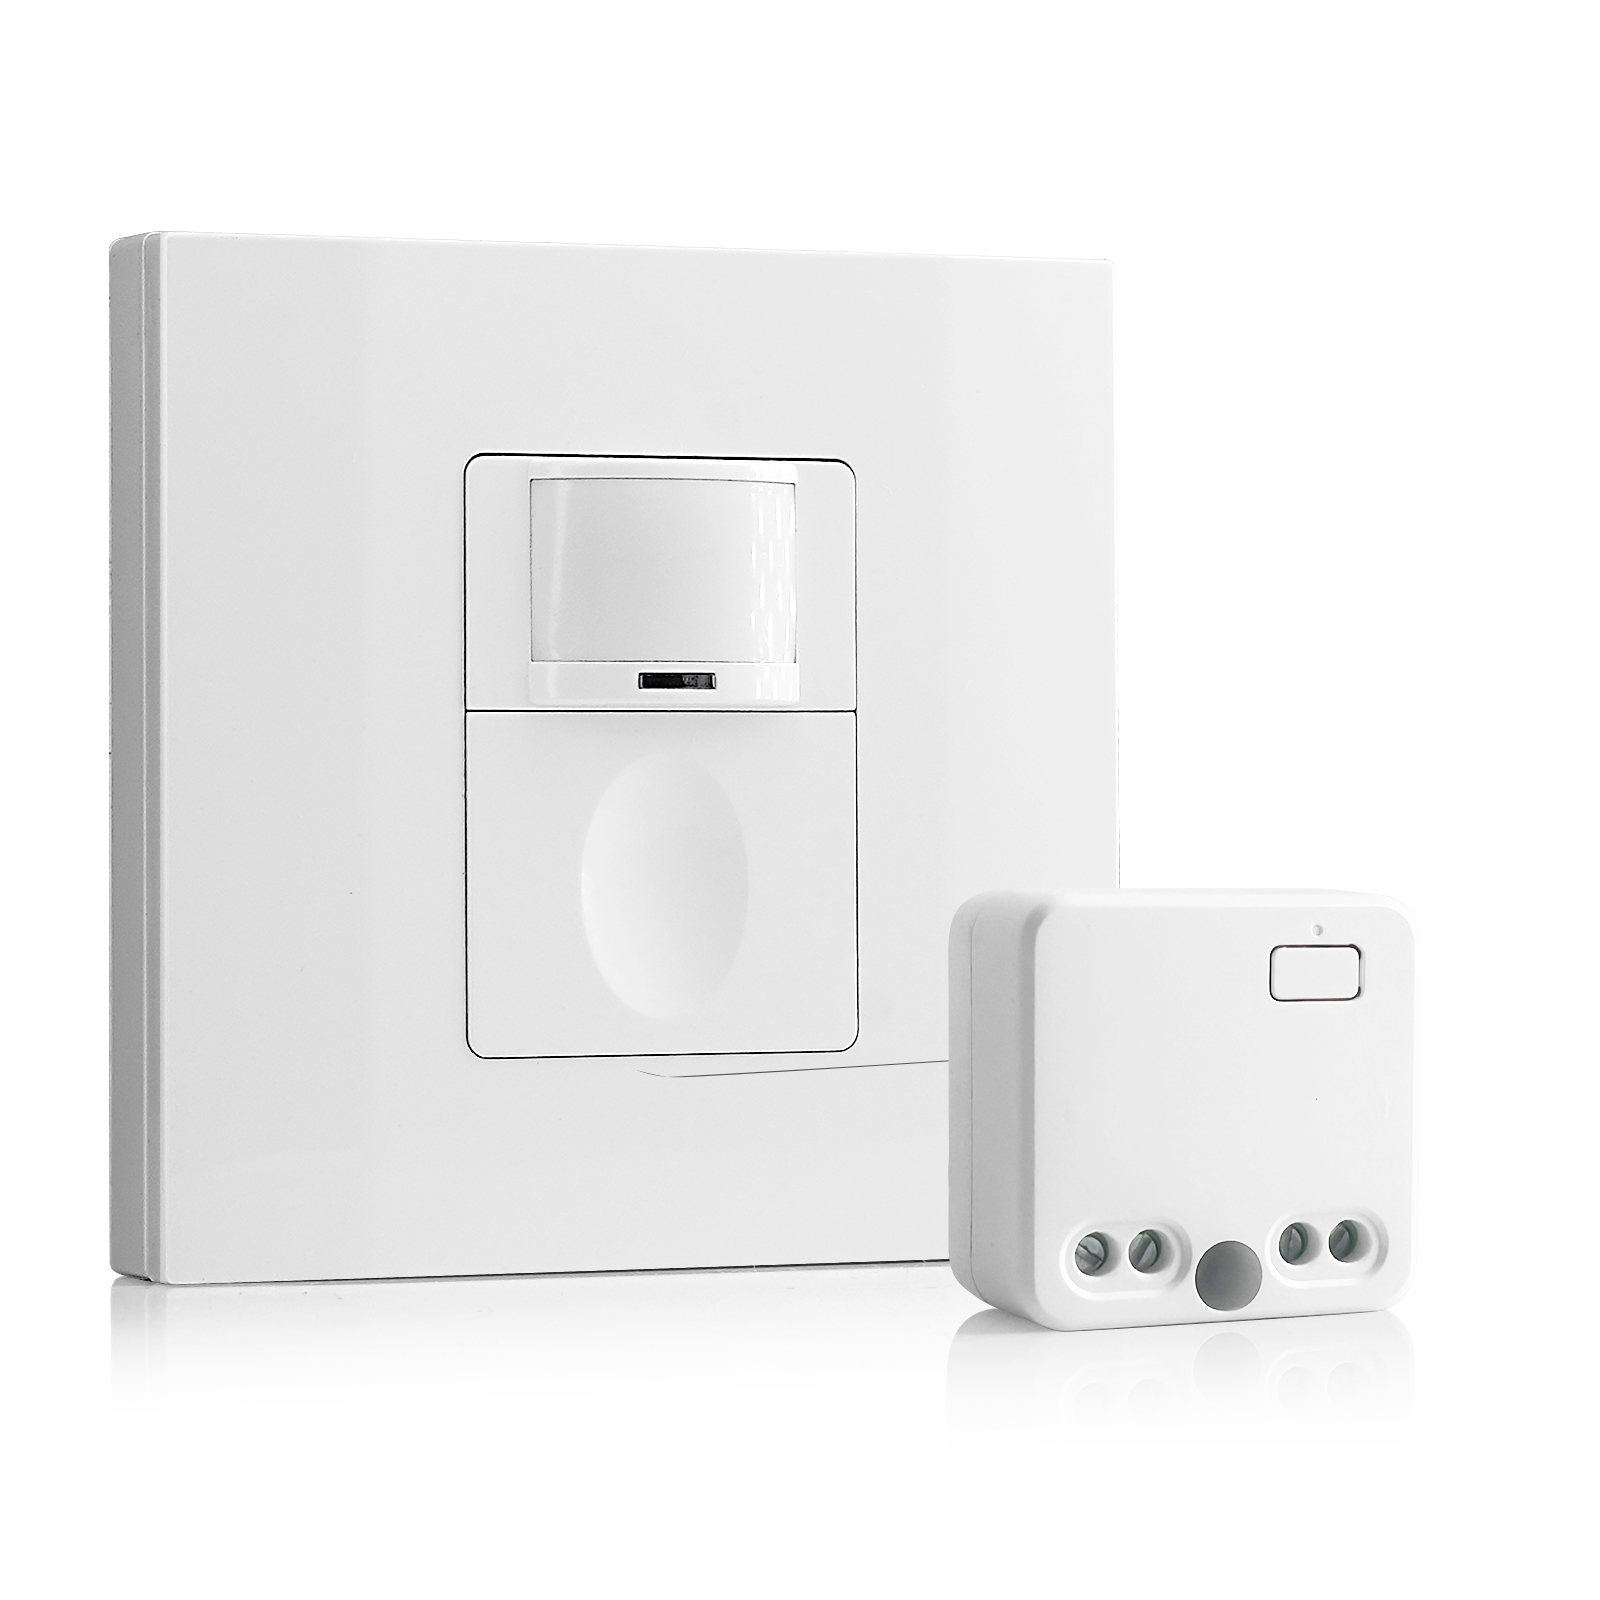
- Wireless switch and receiver kit for indoor ON/OFF lighting control
- 100-230VAC, 50/60Hz receiver with 5A rated current
- CR2032-powered wireless switch with 2.4GHz communication
- Occupancy (Auto-ON/Auto-OFF)
- 12–24V DC (10–30VDC), up to 10A
- 360° coverage, 8–12 m diameter
- Time delay 15 s–30 min
- Light sensor Off/15/25/35 Lux
- High/Low sensitivity
- Auto-ON/Auto-OFF occupancy mode
- 100–265V AC, 10A (neutral required)
- 360° coverage; 8–12 m detection diameter
- Time delay 15 s–30 min; Lux OFF/15/25/35; Sensitivity High/Low
- Auto-ON/Auto-OFF occupancy mode
- 100–265V AC, 5A (neutral required)
- 360° coverage; 8–12 m detection diameter
- Time delay 15 s–30 min; Lux OFF/15/25/35; Sensitivity High/Low
- 100V-230VAC
- Transmission Distance: up to 20m
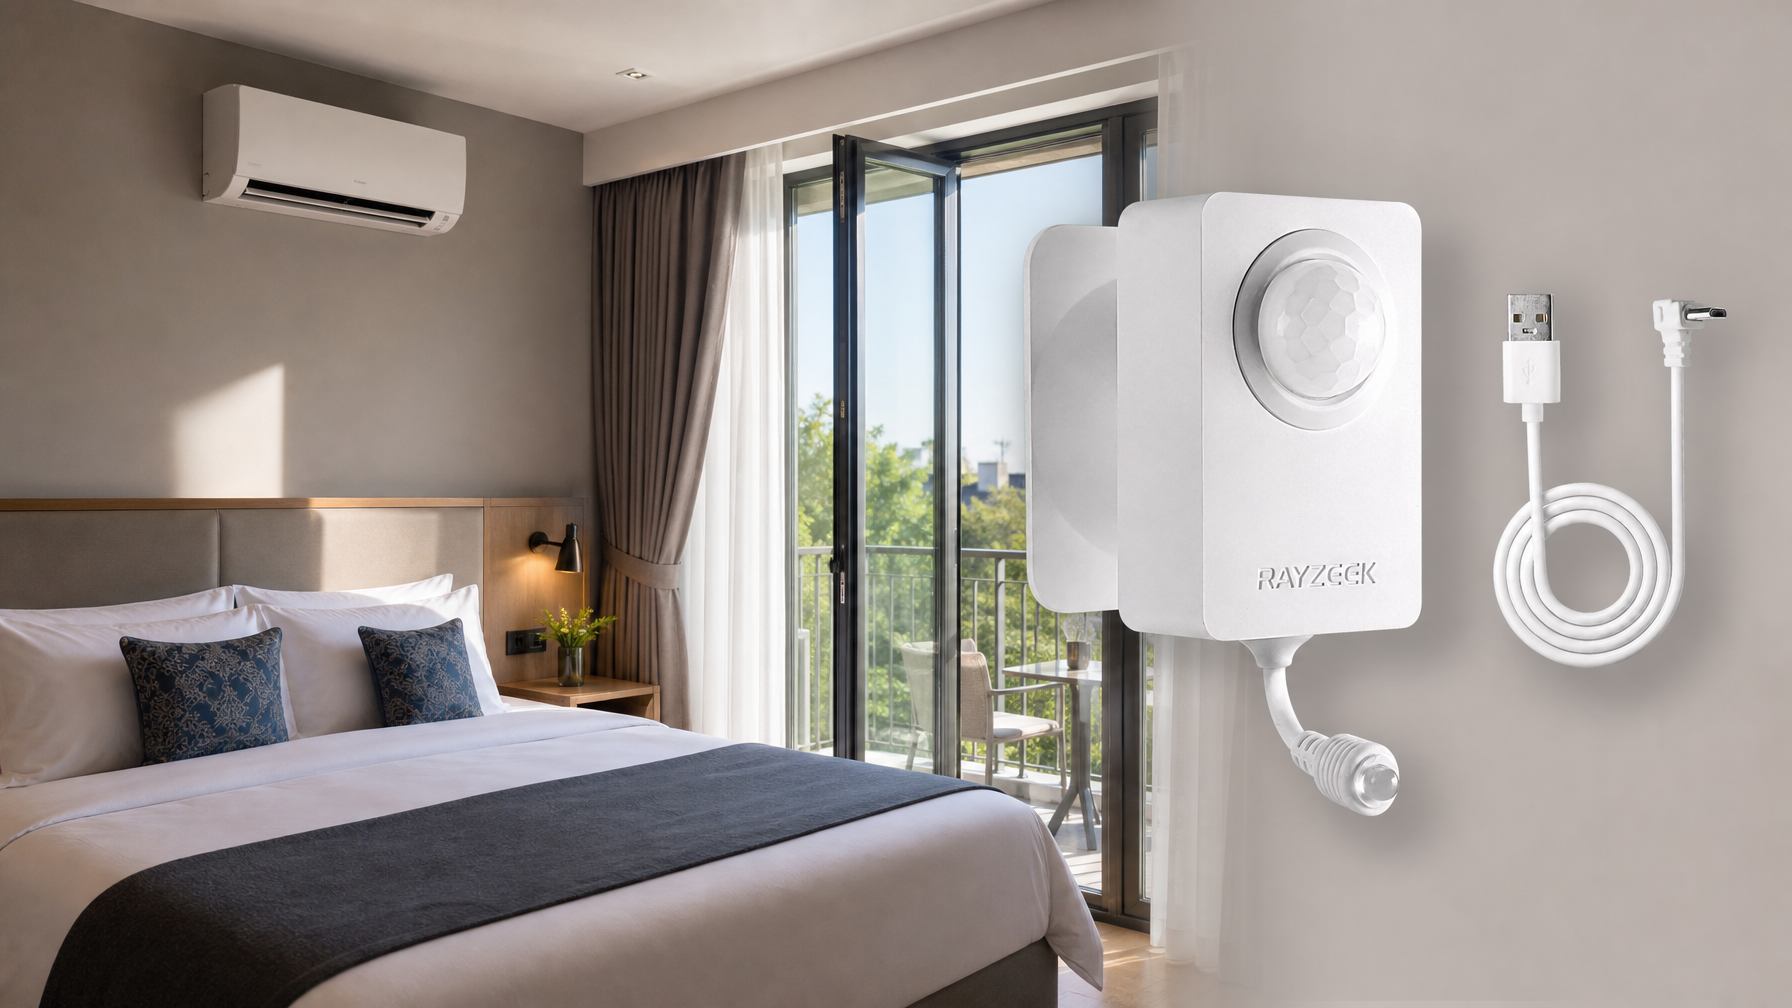
- Wireless motion sensor
- Hardwired control
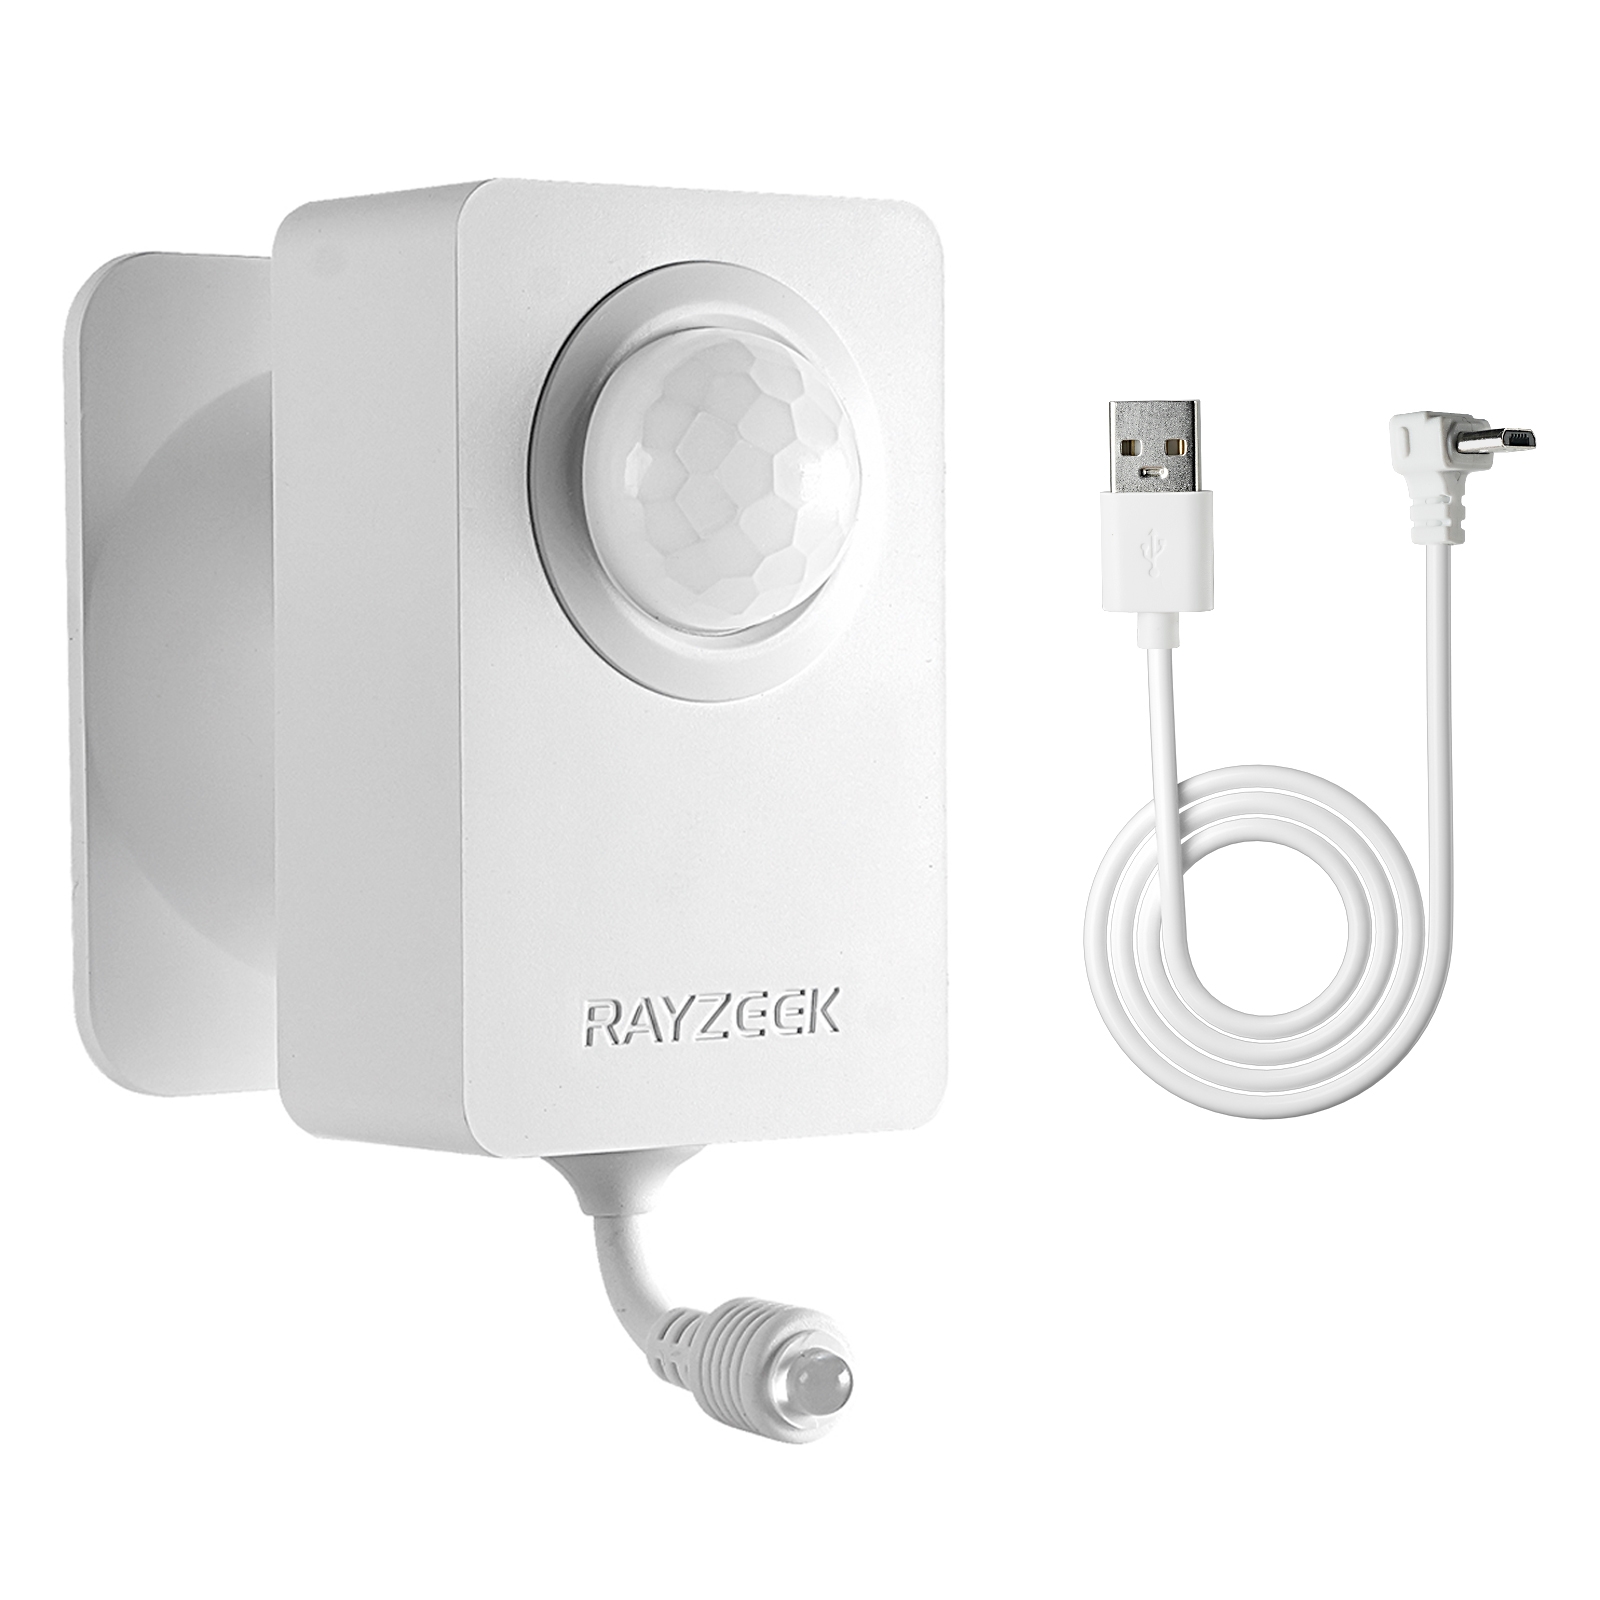
- Voltage: 2x AAA Batteries / 5V DC (Micro USB)
- Day/Night Mode
- Time delay: 15min, 30min, 1h(default), 2h
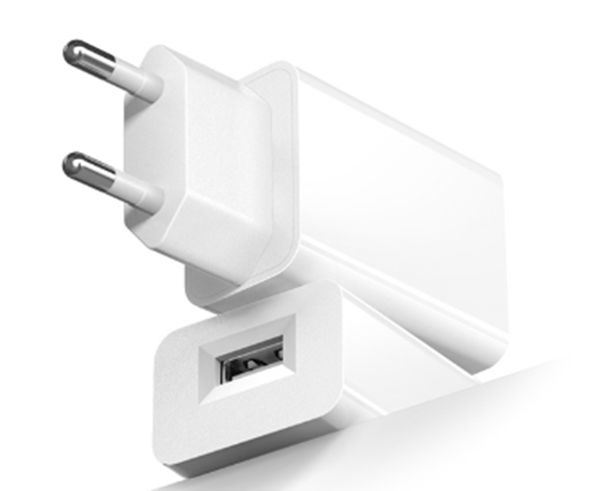
- EU plug power adapter
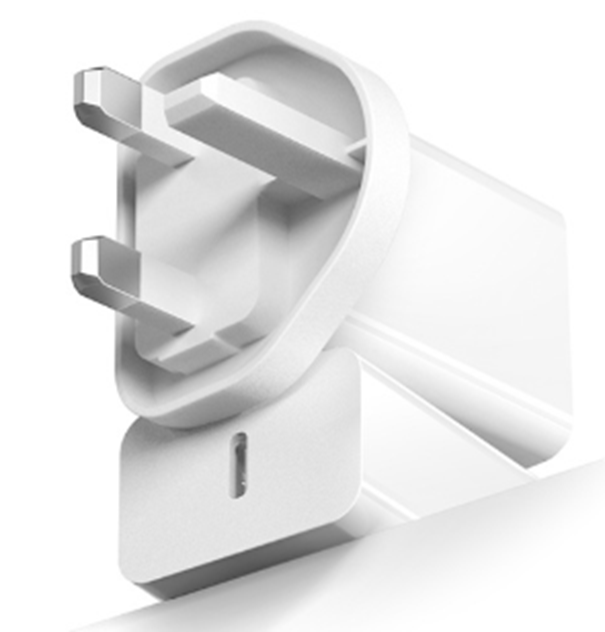
- UK plug power adapter